Introduction
At the beginning of the 1980s, the world witnessed the beginning of the intensive introduction of computer technology into various professional fields and disciplines, causing a radical transformation in many areas, including in terms of content, work processes, and use.
In the article, I share my contribution to the research, development, and implementation of computer support in urban planning in this period. My pioneering work in this field could only be done with the cooperation of the innovative and efficient interdisciplinary team of other mathematicians, computer scientists, architects, geographers, economists, sociologists, and other experts. I am a researcher, developer, and consultant employed at the Urban Planning Institute of the Republic of Slovenia.36 The framework of this article allows only a modest presentation of selected fragments of that period to give the reader some impressions of that time and our role and contribution to it.
Information system for spatial planning
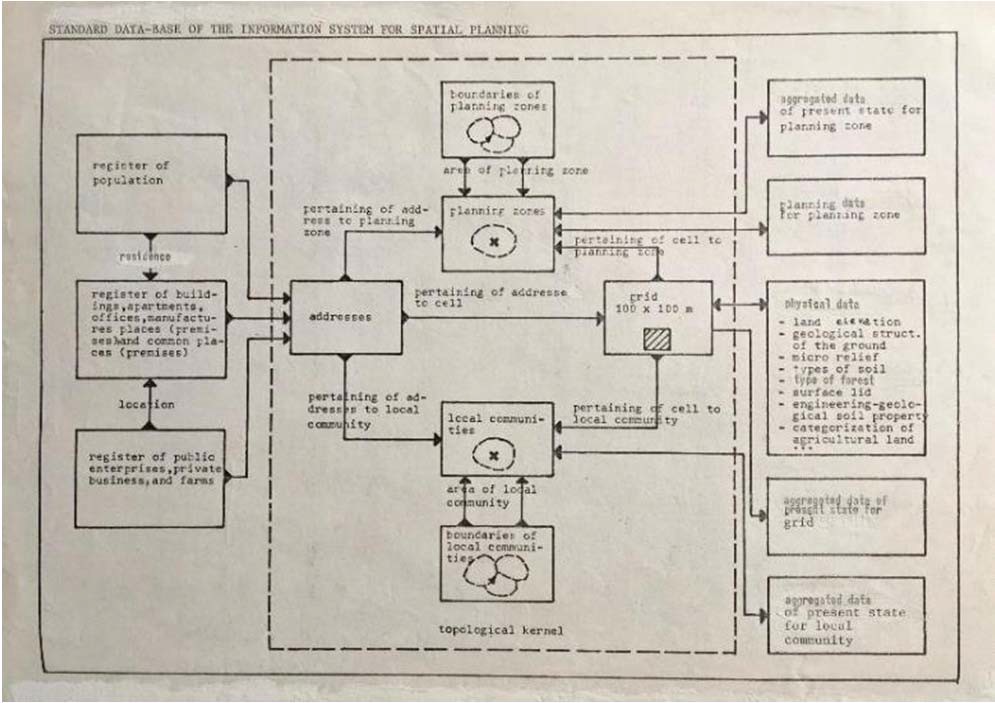
We developed an information system for spatial planning (urban/regional) (ISSP) with two components: a database and a set of procedures. The database consists of data about past and present states and data about planning decisions in the form suitable for use within the planning processes. The essential part of the database is geocoded (geographical reference) data. The set of procedures consists of procedures for database creation and updating, as well as for database use and analysis. The essential part is data use procedures such as data retrieval, methods of statistical analysis, and urban and regional models.
ISSP is a decision-support system designed to satisfy data needs within various planning and monitoring processes on communal, municipal and/or regional levels. It is a user-oriented information system. The system’s main function is not data collection but data processing for end-use. ISSP is not a stand-alone information system, it is highly connected with the other information systems in the country. It thus uses data originating in various information systems (e.g., administrative data, statistical data), and produces data that could be used outside the planning area (e.g. data for local administration).
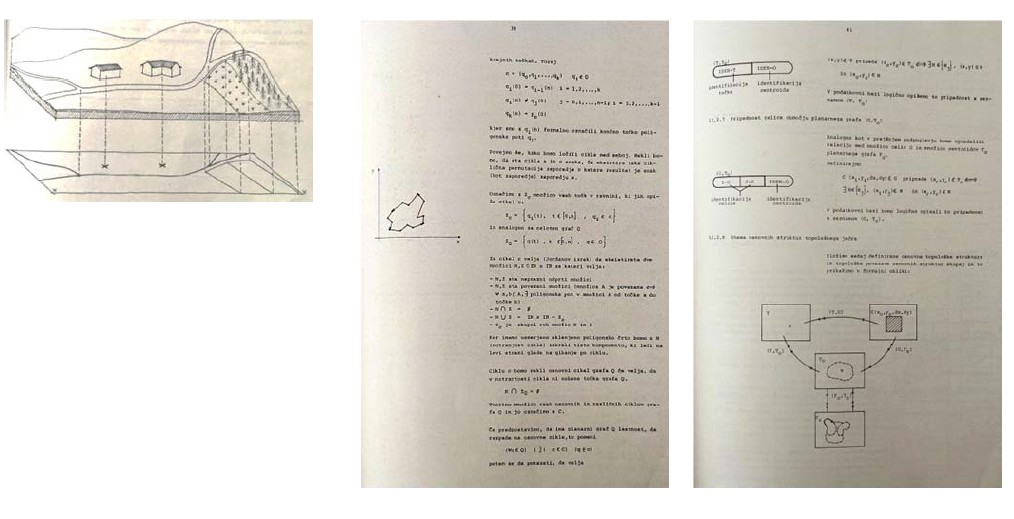
The primary development in this system’s approach (in the sense of innovation and challenge) was integrating the latest knowledge from the theory of information systems, especially that promoted by the field guru at the time, James Martin. I am thinking here of his manifesto of information systems, and the idea that data entities and thus data are more stable than the procedures we want to automate, or that relational databases are in the third normal form, along with work on information technology engineering, computer-aided software engineering, fourth-generation programming languages, RAD (Rapid Application Development), and more. I successfully integrated all this with my mathematical knowledge of topological structures (point, line, polygon ...) and their mutual relationships, which we now know as the basis of geographical information systems.
Data capture example: centroids of house numbers
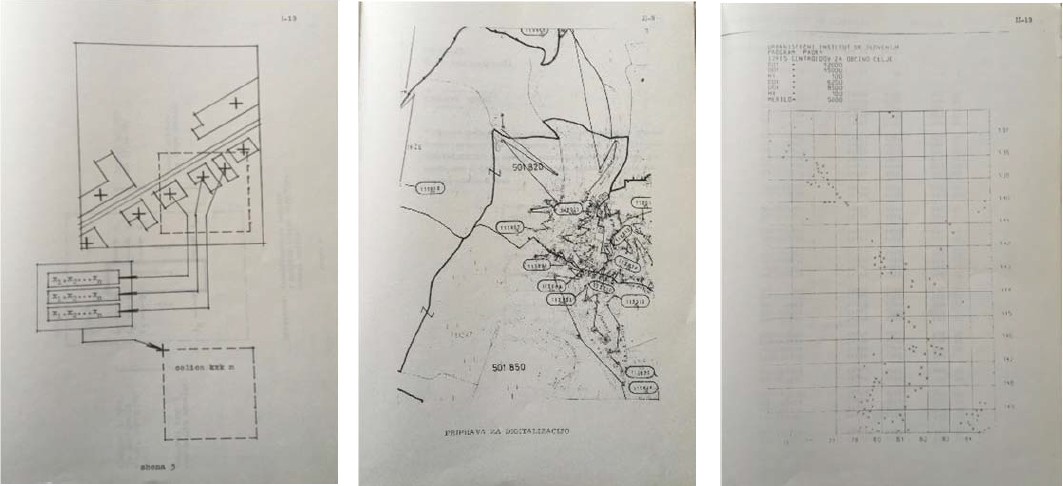
In the 1980s, capturing graphic data was a special challenge. Scanners of larger dimensions did not exist, and those smaller than A4 were difficult to access. Therefore, we had to develop semi-automatic, partly manual procedures for digitization as well as a whole series of software interfaces for transferring data to/from punched paper tape. Let me mention our special innovative approach for digitizing house numbers. The coordinates of house numbers are essential in urban systems because, in this way, we can monitor the state of “living” activity (residents and apartments) and the activity of “work” in the space. We first successfully digitized the house numbers of Celje (approx. 20,000 units) and, a little later, the house numbers of Ljubljana. Their positional accuracy was 5 m. The Surveying and Mapping Authority of the Republic of Slovenia then adopted our method for digitizing all house numbers for the Republic of Slovenia. It transferred the data of the digitized house numbers of Celje and Ljubljana to its EHIS database, which is still regularly maintained. It is worth emphasizing that Slovenia was among the first countries in the world to digitize all house numbers on its territory.
Data output example: first digital maps
Similar to large-format scanners, there was also a problem with large-format plotters and printers at the beginning of the 1980s. To make the first digital maps available to the greatest extent possible, we initially used ordinary line character printers and created fewer and darker areas of the map by overprinting. The problem of character size (rectangle and not square) was solved by mathematical 2-dimensional interpolation.
We prepared a library of computer programs for handling (processing and storage) the cellular organization of the spatial database. The cellular organization of a spatial database is called an organization, where the basic spatial unit is a grid cell (square) for which we have a specified vector of data. The purpose of the program library is to simplify the programming of applications for entering data, analysis (statistical, spatial ...), models (projections, simulations ...), and for outputting results (graphic displays, tables, diagrams ...). The library contains programs for:
- creating, opening, closing, importing, and exporting data from the database (C-files, CF-files),
- print data to a line printer (GRAFC7, GRAFC8),
- data plotting on a Versatec plotter (GRAFCP).
We wrote most of the programs in the programming language FORTRAN (FTN), but some of them in COMPASS and PASCAL 6000. Cyber record manager-basic access methods (word addressable) are used to manage the databases with the support of the NOS operating system, /BE 1.3 on a CYBER 72 computer.
Methods example: expert systems
In this period, we developed several procedures for database creation and updating as well as for database use and analysis:
- elementary algorithms dealing with segment-oriented database (e.g. point-in-polygon, minimal path), preparation of experimental software system for management (update, retrieval) of the segment-oriented databases;
- models of population projections and simulations (“cohort survival method”);
- spatial interaction models (Lowry-like models based on the principle of entropy maximizing with inequality constraints);
- employment model for estimation of the jobs needed, based on population projection;
- housing model for estimation of the apartments needed, based on population growth and the existing housing fund;
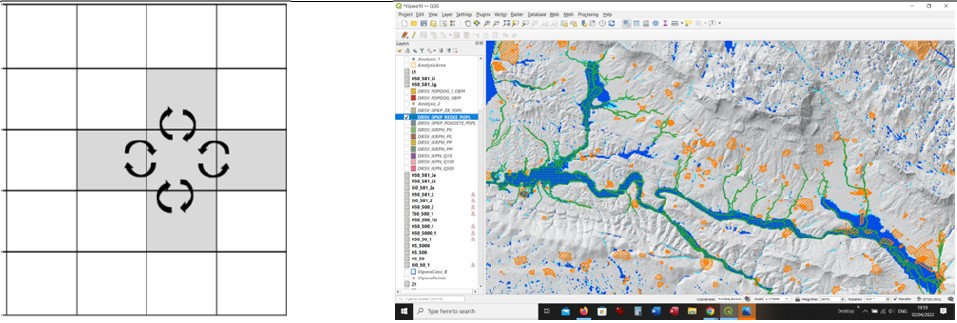
- multi-zoning population projections and simulations (“cohort survival method”), maps overlapping, grid-based maps of different physical indicators (e.g., type of soil, relief, land use) are overlaid with a combination of “and” and “or” relations;
- grid-based catchment area simulation model for the location of local services (e.g. primary school, nursery school, health station).
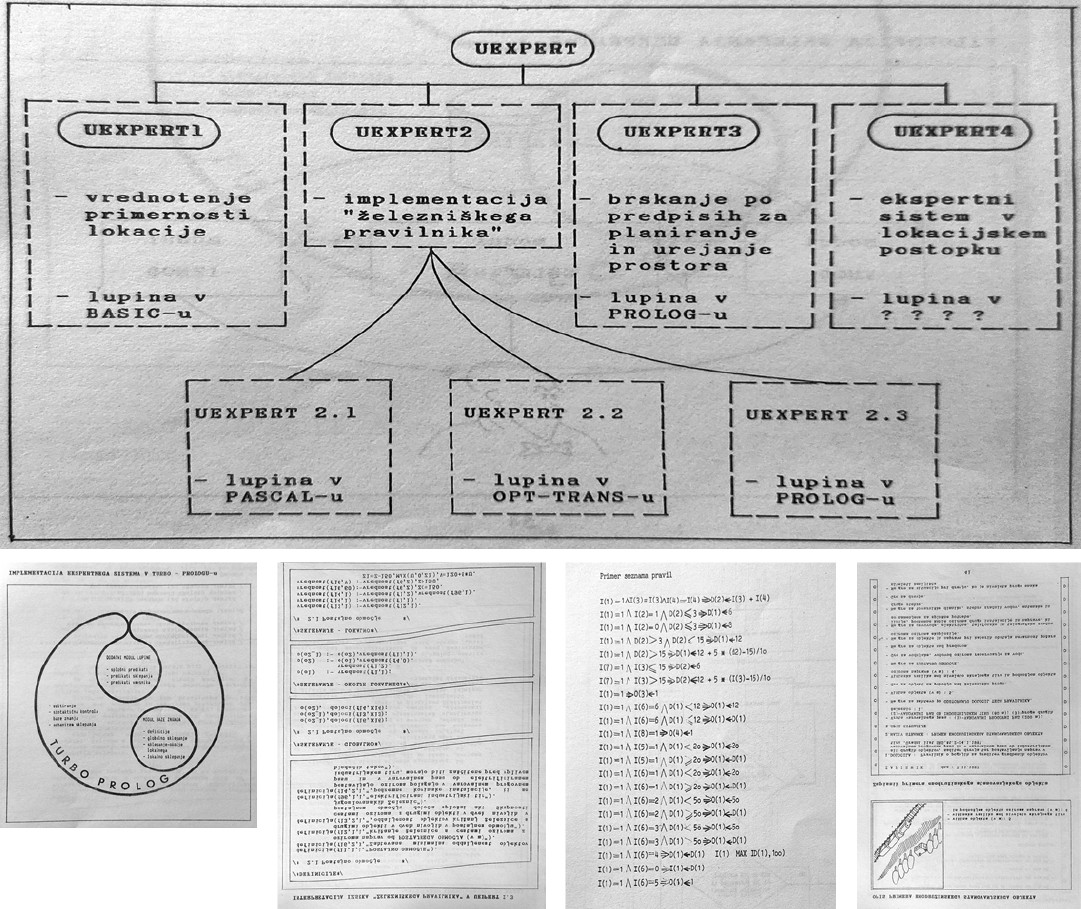
We realized very early that using rule-based expert systems or an automatic learning system is very promising for use in urban and spatial planning. We collected some examples of the use of expert systems in related fields, identified potential opportunities in spatial planning, and reviewed the availability of existing end-user software. After rethinking the gathered material we developed several expert system prototypes, named UEXPERT (Figure 5).
Implementations: Celje and Ljubljana municipalities
For me, the reason for getting involved in implementation projects is twofold: to advise and assist in the actual development of an information system for urban and/or regional planning in a specific area, and get practical experience for further research work and preparation of legal acts in the spatial planning field. In the period 1970–1985, we implemented the following ISSP:
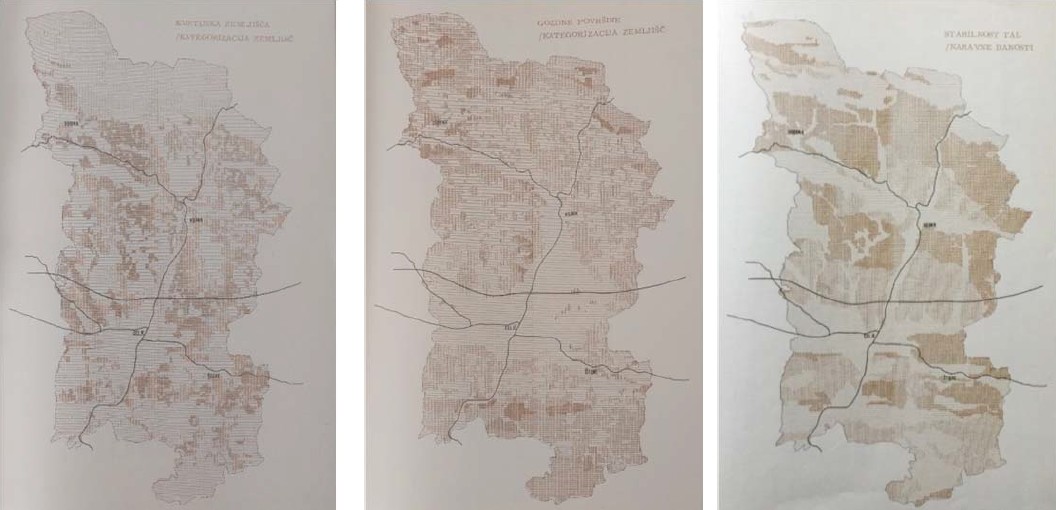
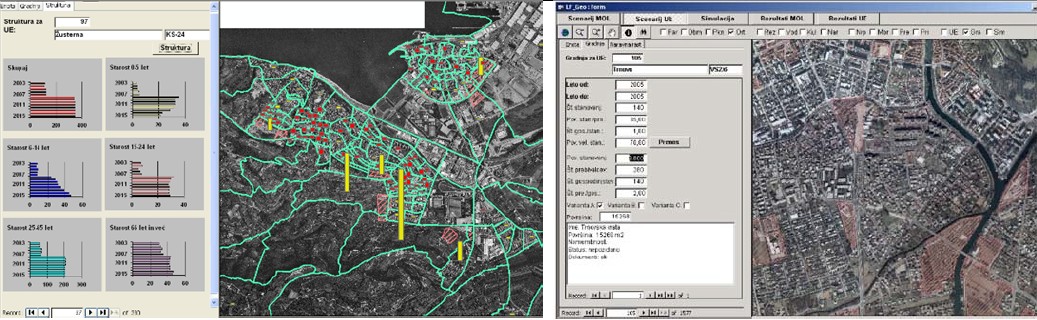
- Municipality of Celje (60,000 inhabitants, 250 km2); Two databases were established. First, the “basic database” with a house number as the basic georeferenced unit to which microdata from several registers are linked (population, housing, business premises, vehicles). Second, the “planning database”, where the base georeferenced unit was a grid cell (100x100 m), data consisted of aggregated data from a basic database and directly captured data on physical spatial characteristics (altitude, terrain slope, orientation, soil stability, agricultural land, forest land, protected areas, etc.). The database was used in the preparation of the Celje municipality spatial plan.
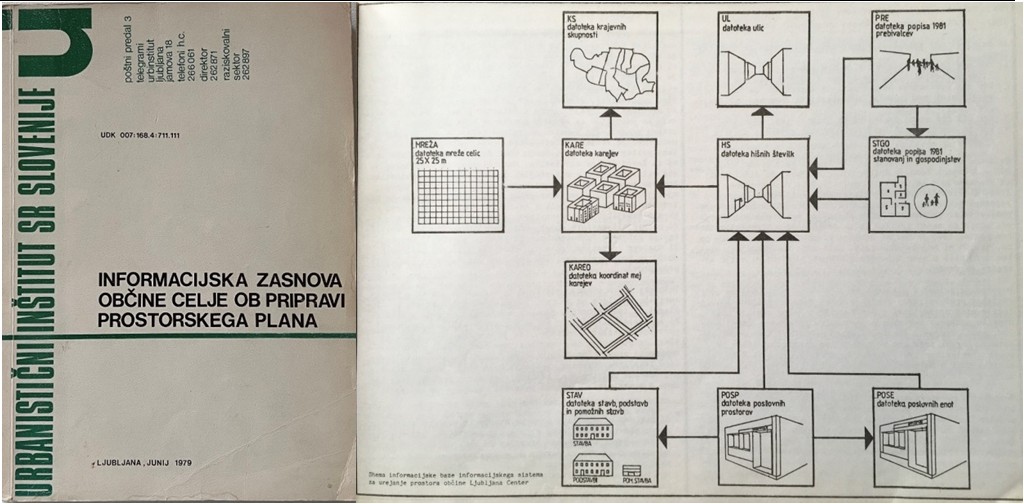
- Municipality Ljubljana–Center (32,000 inhabitants, 5 km2); In designing the contents of Ljubljana information system we used the general principles of ISSP, and also the following specific demands have been considered: specific areas in the Ljubljana–Center commune (CBD, renovation areas), besides urban planning it also supported specific administrative procedures (e.g., a process for location permission), existing data sources were used as much as possible (e.g., 1981 census data, register of business premises, register of territorial units), this was the pilot implementation project for the establishment of the register of buildings. The information system included a very detailed database with micro data on business premises, buildings, households, and inhabitants (see the scheme enclosed).
- Municipality of Ljubljana (200,000 inhabitants, 500 km2); The essential part of the implementation of ISSP Ljubljana was monitoring the actual land use compared to planned land use. The purpose of this monitoring was to get permanent and systematic evidence of all changes in planned land use, simple and publicly accessible insights into the regulation status of planned land use, permanent and analytical comparisons between actual and planned land use, and simple and objective evaluations of the consequences of suggested changes in planned land use. The central part of the information system was a database where various types of data were located in planning zones. The information system was used in the preparation of spatial planning acts, part of a project called Ljubljana 2000.
- The Ljubljana region (16 communities, 600,000 inhabitants, 5,000 km2); The regional locational model has been implemented in the Ljubljana region within the preparation of the regional development plan as part of the Ljubljana 2000 project. Six different alternatives to urbanization have been prepared and examined with the support of the regional locational model: concentration, deconcentration, north, south, residential neighborhoods, and balanced.
Implementation: Guyana
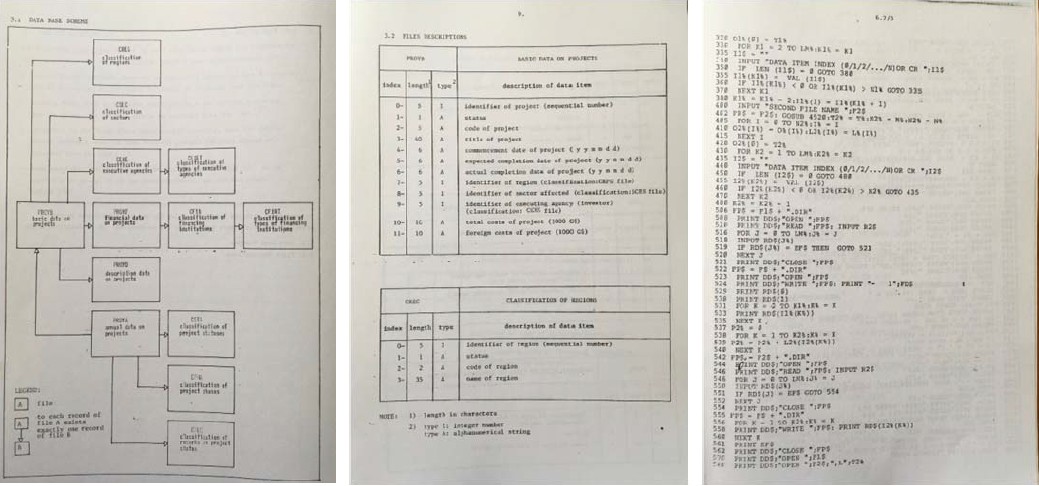
From 1983–1985, I had the opportunity to participate as part of an international consulting team in Guyana in the project “Institutional Support for National Systems of Planning and Projects in Guyana”. The project was financed by the InterAmerican Development Bank. I managed the sub-project “Information System for Planning and Projects”. The Cooperative Republic of Guyana was a then developing country in South America with about 800,000 inhabitants. The purpose of developing the information system for planning and projects was to provide data support for national economic and social planning and central coordination of sectoral and regional planning, monitoring/planning projects, and corporation monitoring at the national level. We developed the information system in two phases:
- Recommendations: diagnosis, the concept of the information system, information engineering for the information system, recommendations for immediate improvement.
- Initial implementation: the clarified concept of the information system, the survey of existing data, the survey of computer resources, initial data dictionary, experimental database – list of current projects, experimental data base – 1980 census data.
At that time we developed MDBMS2 (Micro Data Base Management System Version 2). It was a simple database management system written in BASIC for ID-80 (Iskra Delta-80, the microcomputer that came before the ID Partner). It was used for a database of urban planning documents held by the City of Ljubljana. In Guyana we rewrote the program in BASIC for an Apple IIe. The program was used for database management for a list of projects in Guyana (Figure 7).
Comparisons and disseminations
When innovating complex information systems, it is necessary to constantly check the development and implementation of foreign efforts in this field. Nowadays, this is much easier due to the Internet and the wider availability of information. At that time, it was necessary to rely on the latest professional books, scientific articles, publications from professional conferences, and direct visits to individual professional institutions. Hence, to get information in 1983 I had to visit some universities, institutes, and other European institutions and make an evaluation. At the end of this trip, I wrote some observations:
- In the field of urban planning information systems, we can claim that our research is entirely comparable to that in foreign countries (although they are otherwise more financially supported and, above all, have better computer equipment at their disposal), so we count on the exchange of specific research results.
- The development is towards the implementation of less complex, cheaper information systems, which provide financial effects in the form of savings in a short period.
- According to the state of information systems that actually work in practice in this area, Sweden and some cities in Great Britain are well ahead of us, while we can note that we surpass Scotland in some areas in terms of implementation.
- In the countries visited, they placed a great deal of emphasis on introducing microcomputers and developing software for microcomputers. Still, during the visit they did not yet have any significant experience in this field.
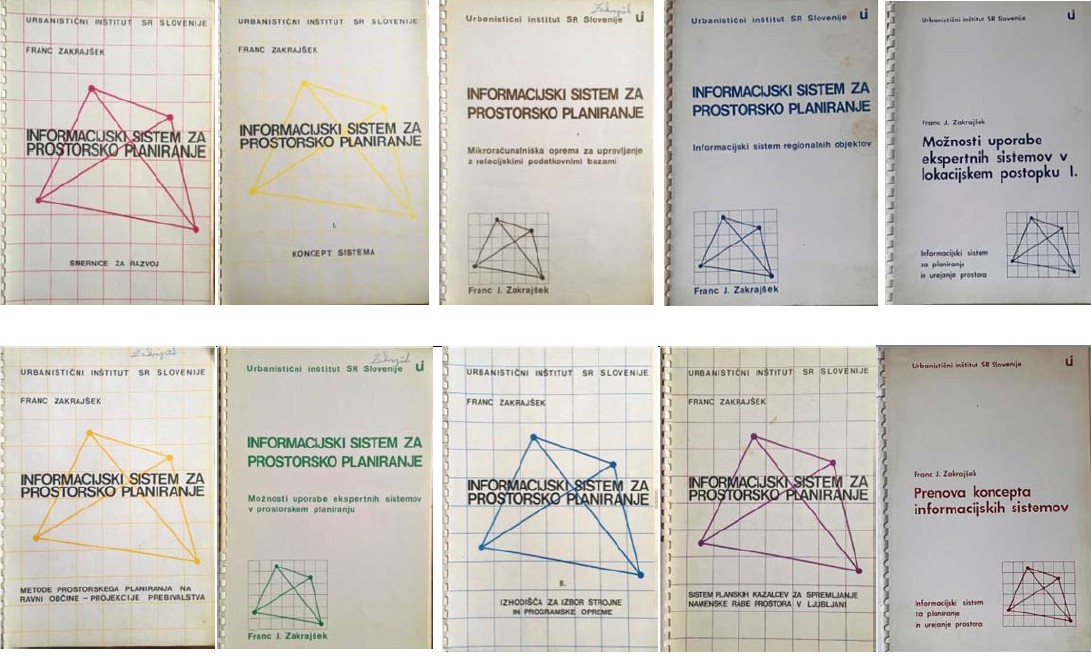
On the other hand, and despite the easier access to information, it is still vital today to verify research results in professional journals, publications, and conferences. During this period, we published research results almost every year at least at two conferences within the former Yugoslavia, one in the field of spatial planning and the other in the field of computing and informatics. A fundamental form of dissemination was also the publication of our achievements, and some title pages are presented in Figure 8.
We printed several hundred copies of the publications and “sold” them to institutions throughout the former Yugoslavia. Despite the publications being in Slovenian, there was great interest in them.
After 50 years
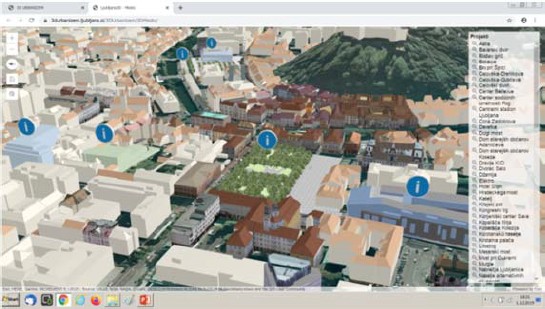
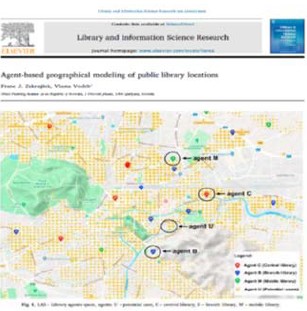
After 50 years, we are still very present in the research, development, and implementation of computer support in urban planning. Some links for our recent work are provided in Figure 9.
Figure 9: After 50 years
36. The Urban Planning Institute of the Republic of Slovenia is one of the leading institutions in Slovenia and ex-Yugoslavia regarding research, implementation, and consulting within urban and regional planning. It was established in 1955, and is highly connected with similar institutions in Europe and the USA.